Quickstart
Upload your first file and see an AI-generated dashboard in under two minutes.
This guide walks you through the core DuckViz workflow: upload a file, let the AI analyze it, build a dashboard, and generate a report.
Building an app instead?
If you're a developer who wants to embed Explorer / Dashboard / Report / Deck in your own React app, jump to the developer quickstart — npx duckviz create-app my-app scaffolds the whole thing with a demo dataset already wired up.
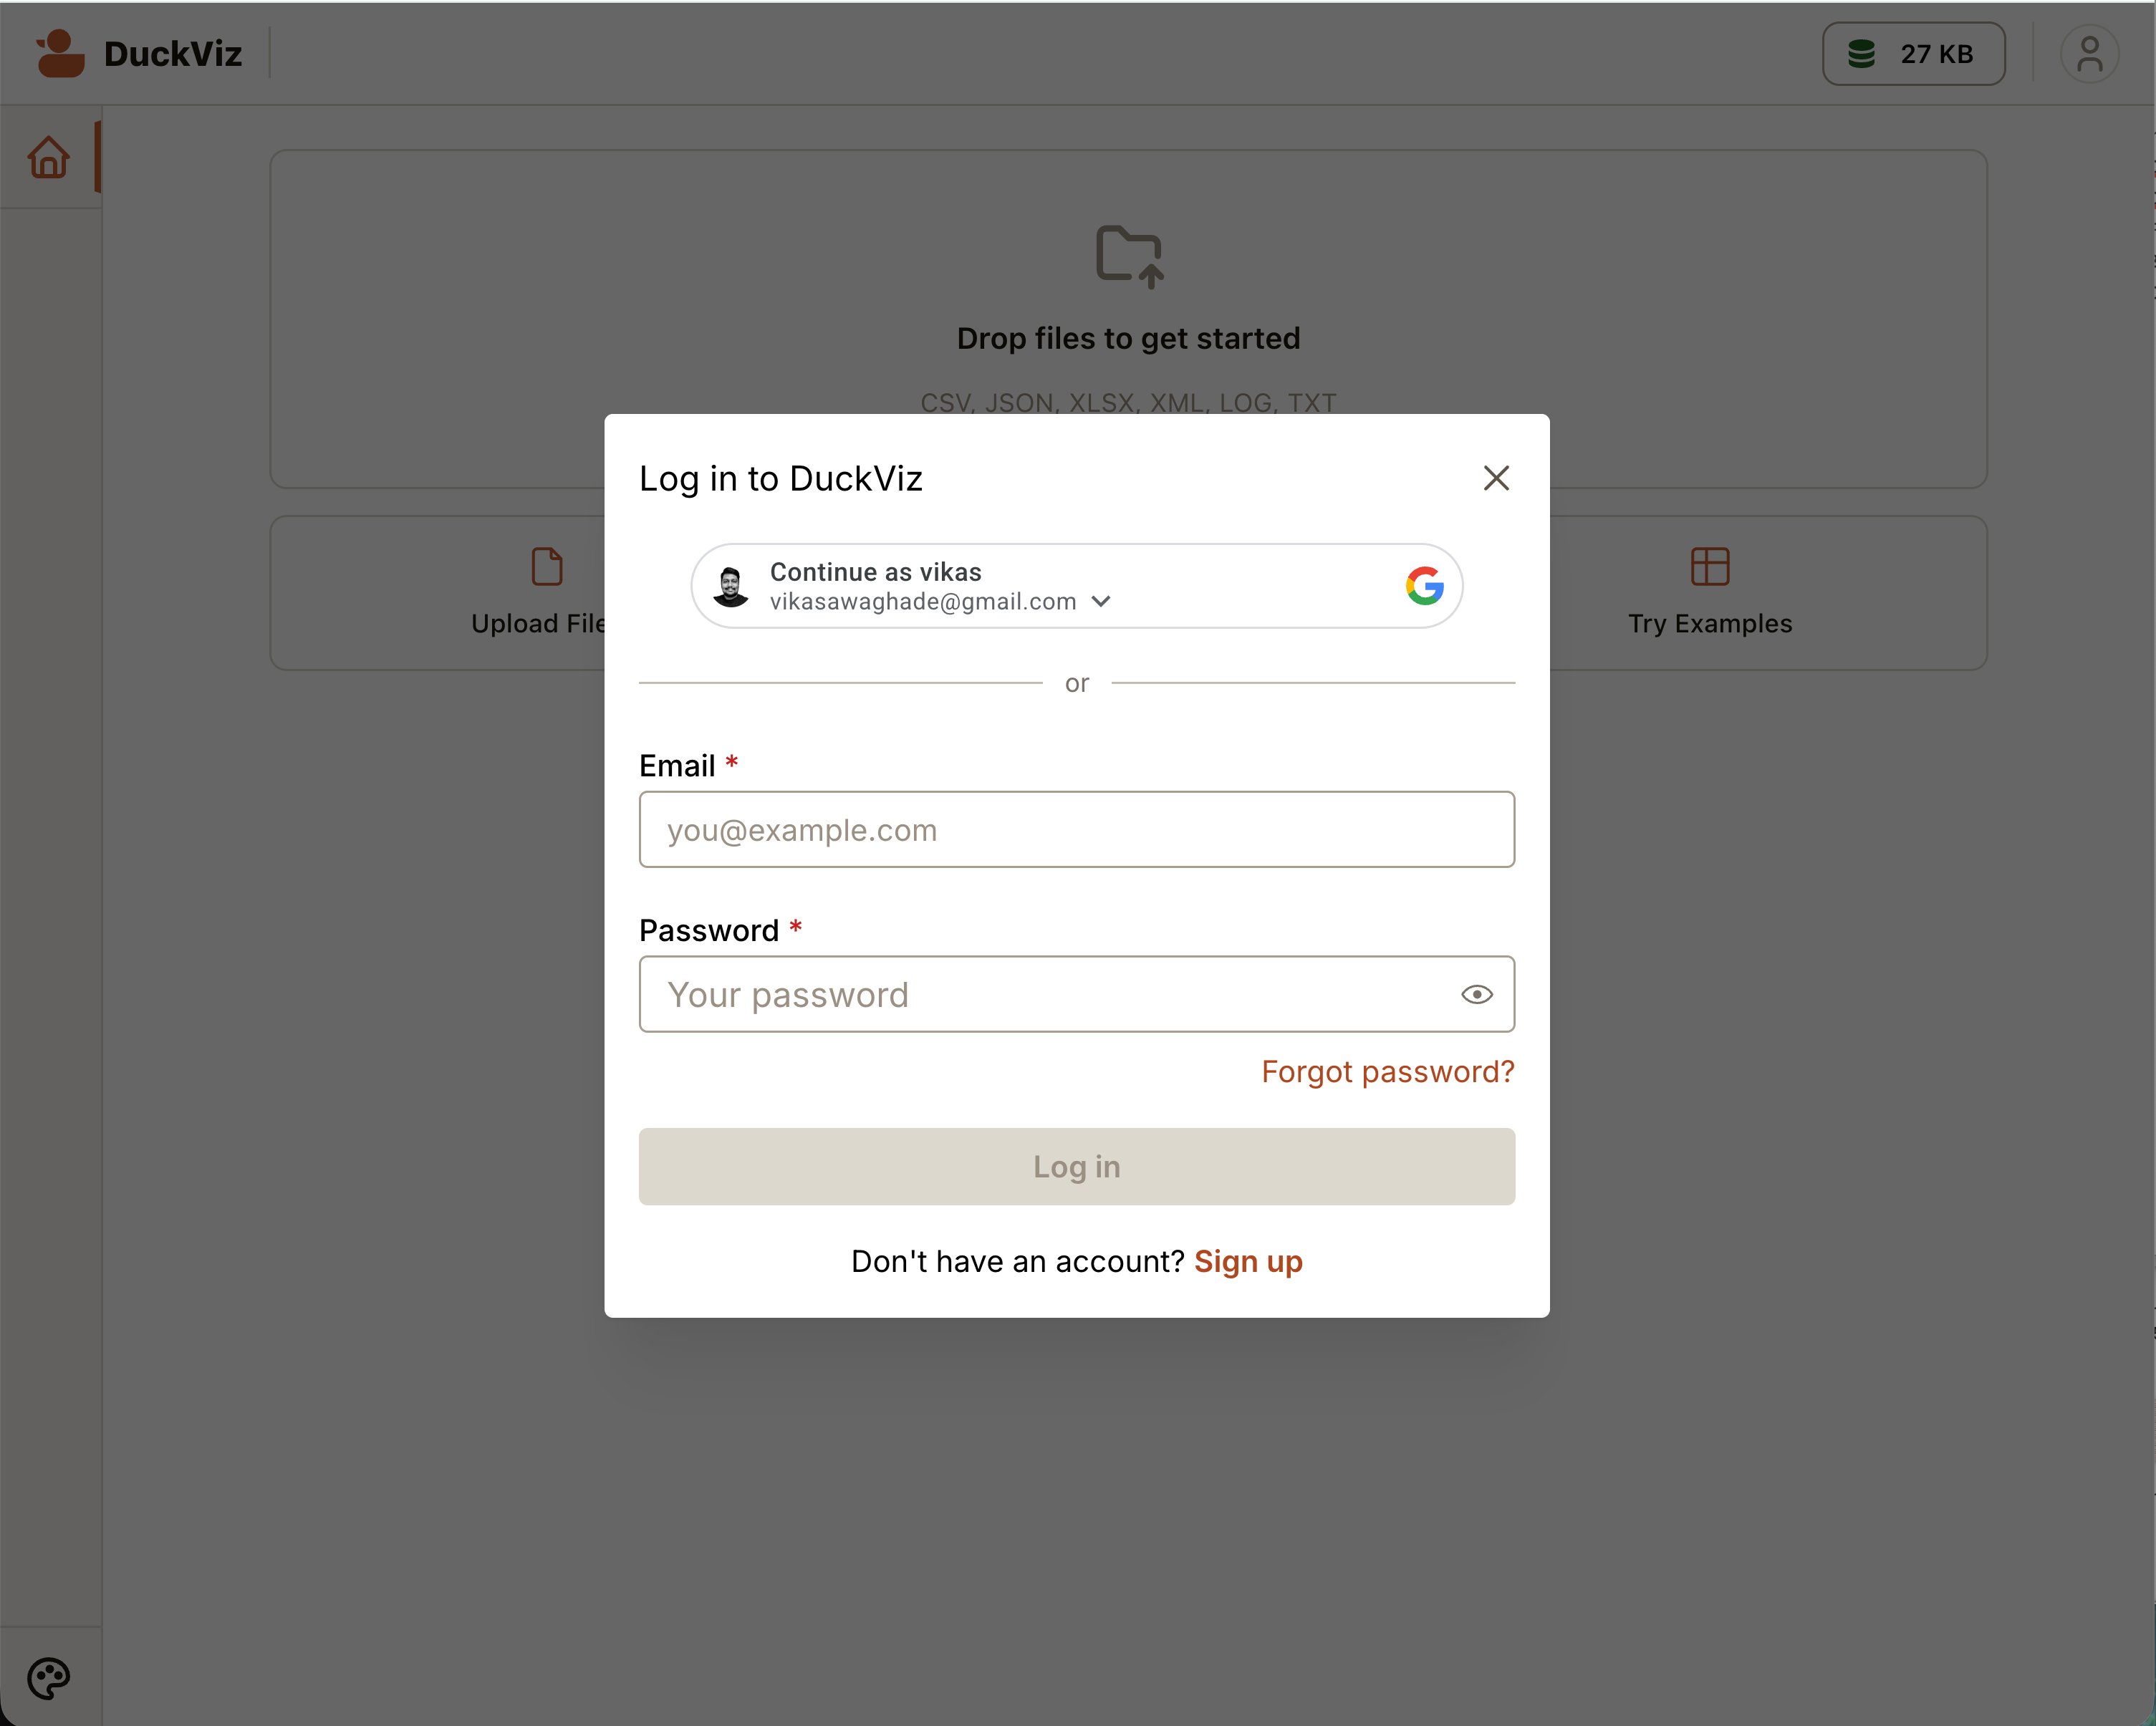
Create an account
Go to app.duckviz.com and sign in with Google or email. New accounts receive free credits automatically — no payment info required.
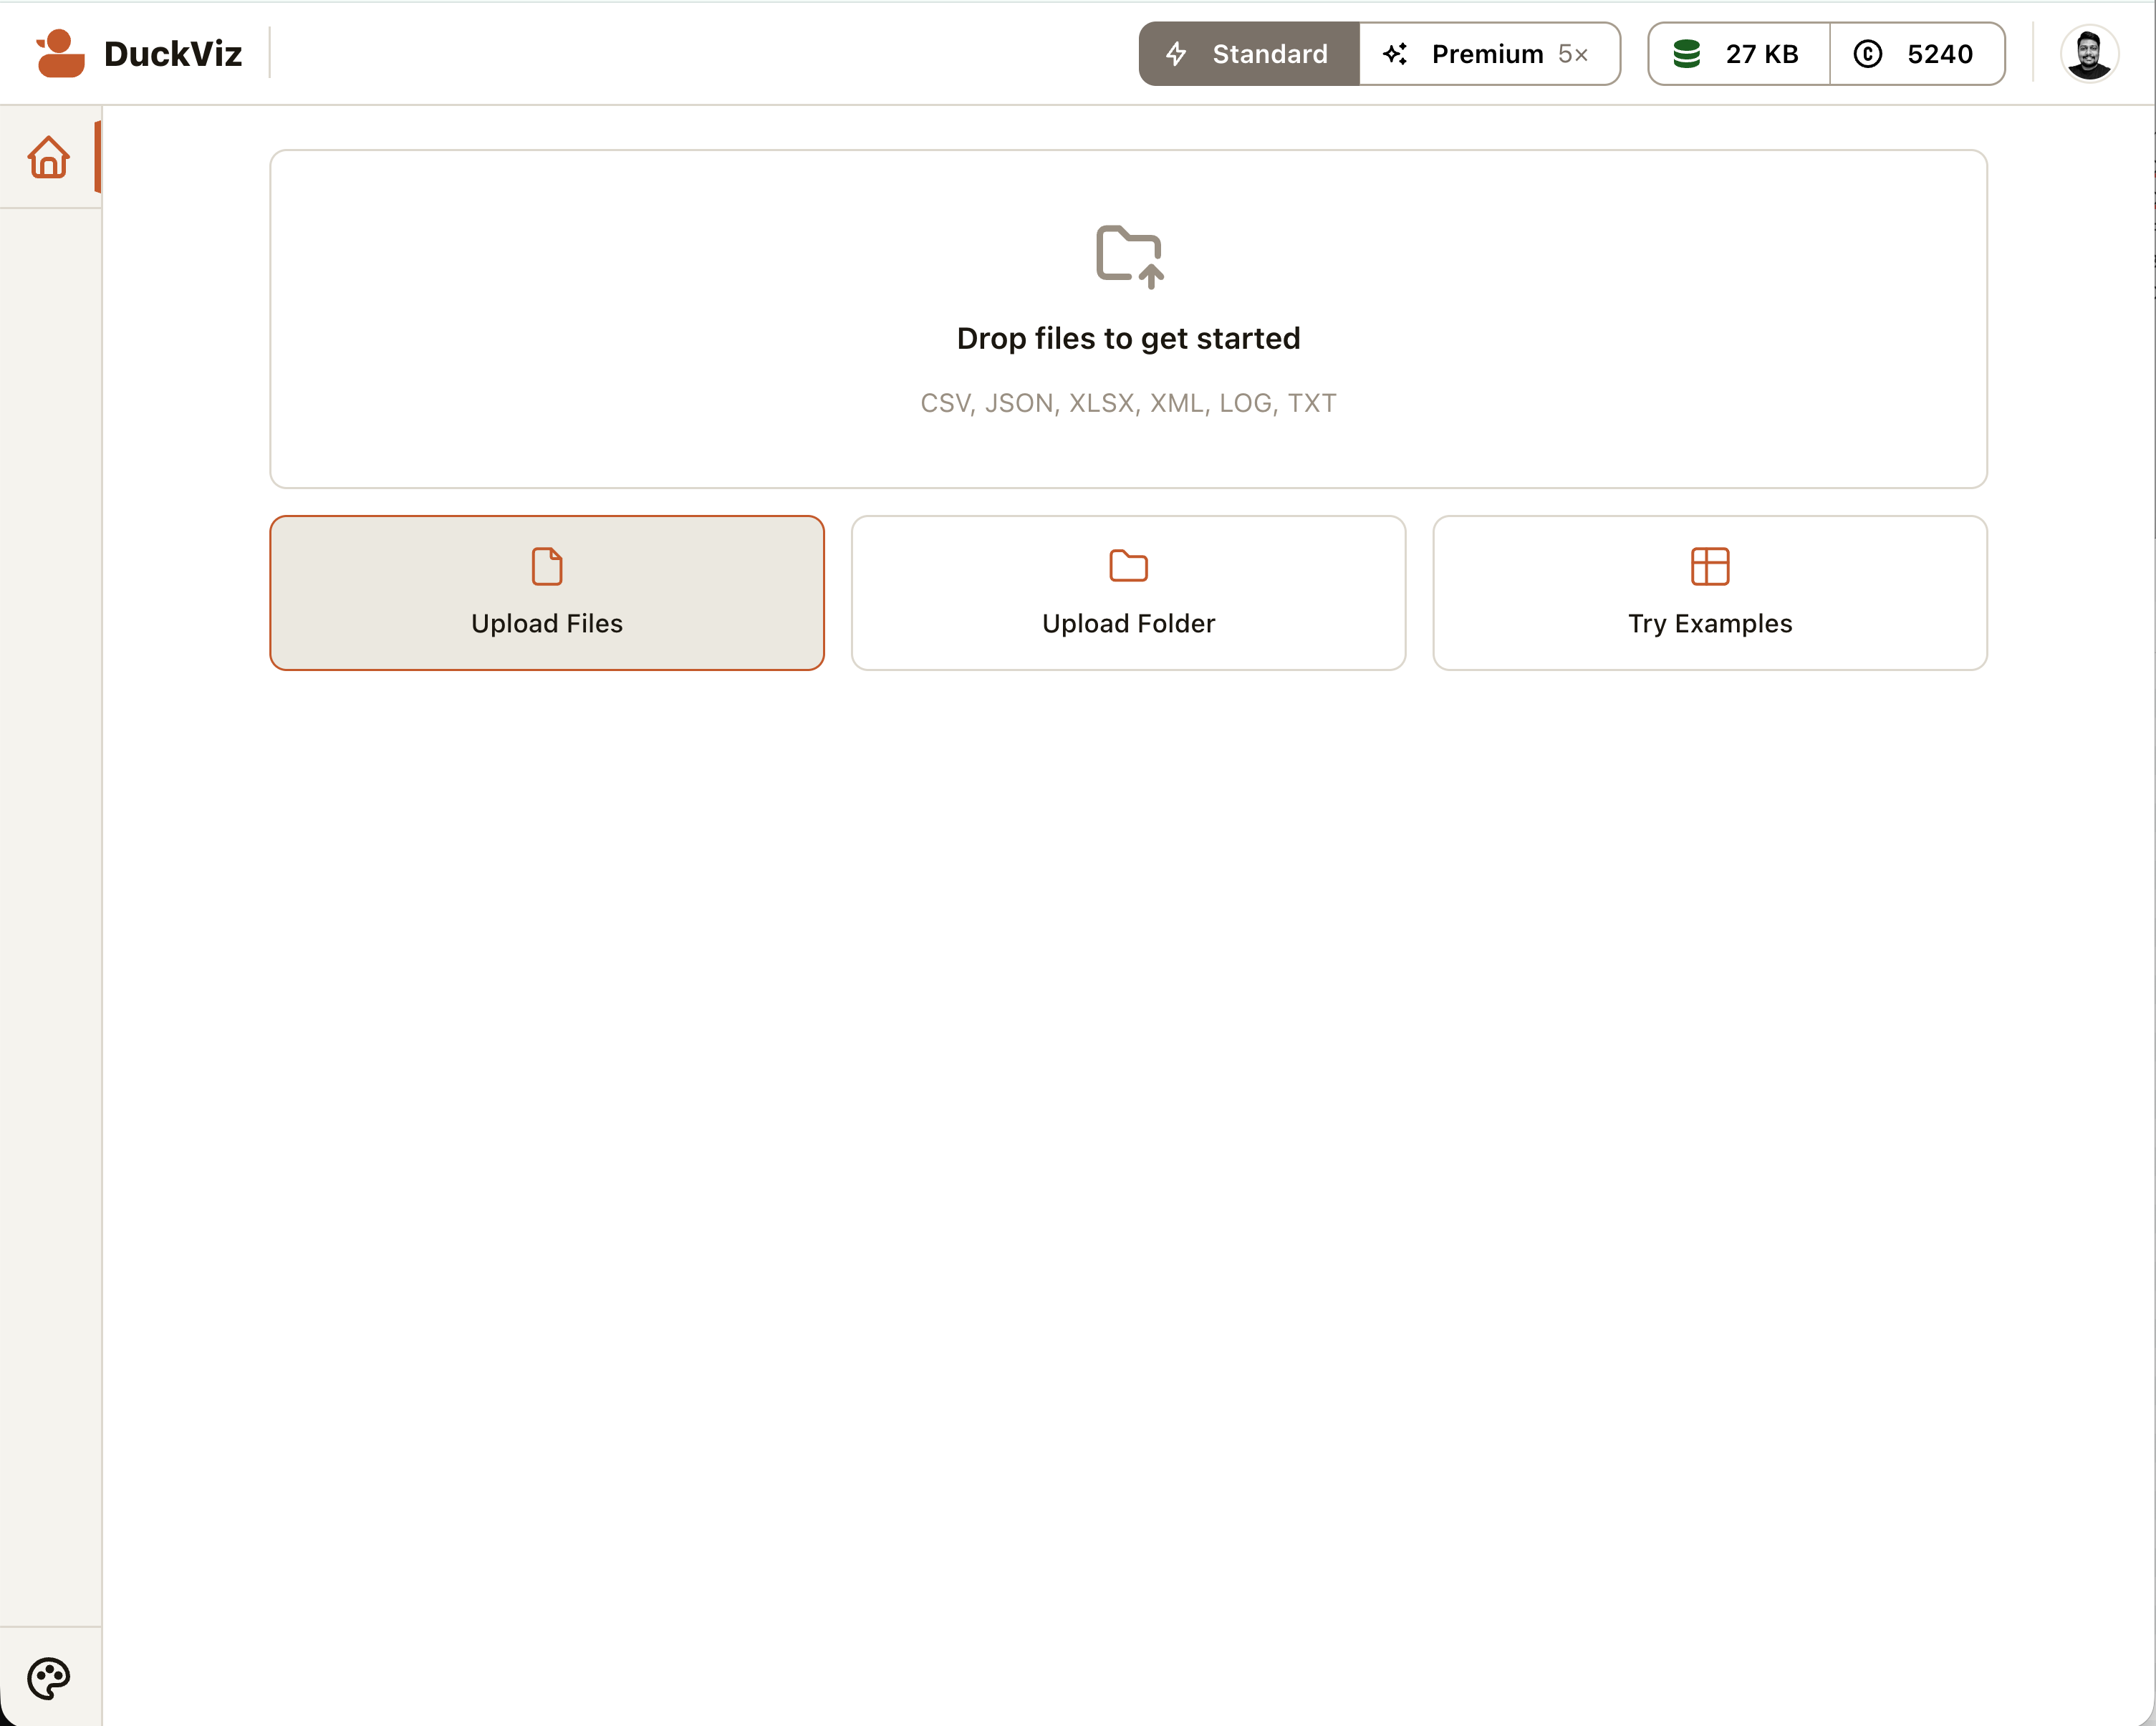
Upload a file
From the Home screen, click Upload and drop a file. DuckViz supports:
- CSV / TSV — comma or tab-separated
- Excel —
.xlsxand.xls - JSON / JSONL — objects or arrays of objects
- XML — structured elements
- Log files — syslog, CLF, combined, Windows Event, and custom formats
You can also drop an entire folder — DuckViz walks it recursively, skips binaries and dotfiles, and ingests each supported file into its own table.
Privacy first
Your file is parsed locally in the browser by DuckDB-WASM. Nothing is uploaded to our servers. See Privacy-First Architecture for details.
Explore the data grid
After ingestion, you land on the Explorer — a three-panel layout:
- Left sidebar — file tree showing all ingested tables
- Center — interactive data grid with column profiling and a SQL workspace
- Right panel — AI widget recommendations (once generated)
Click any column header in the grid to see data types, null counts, and value distributions.
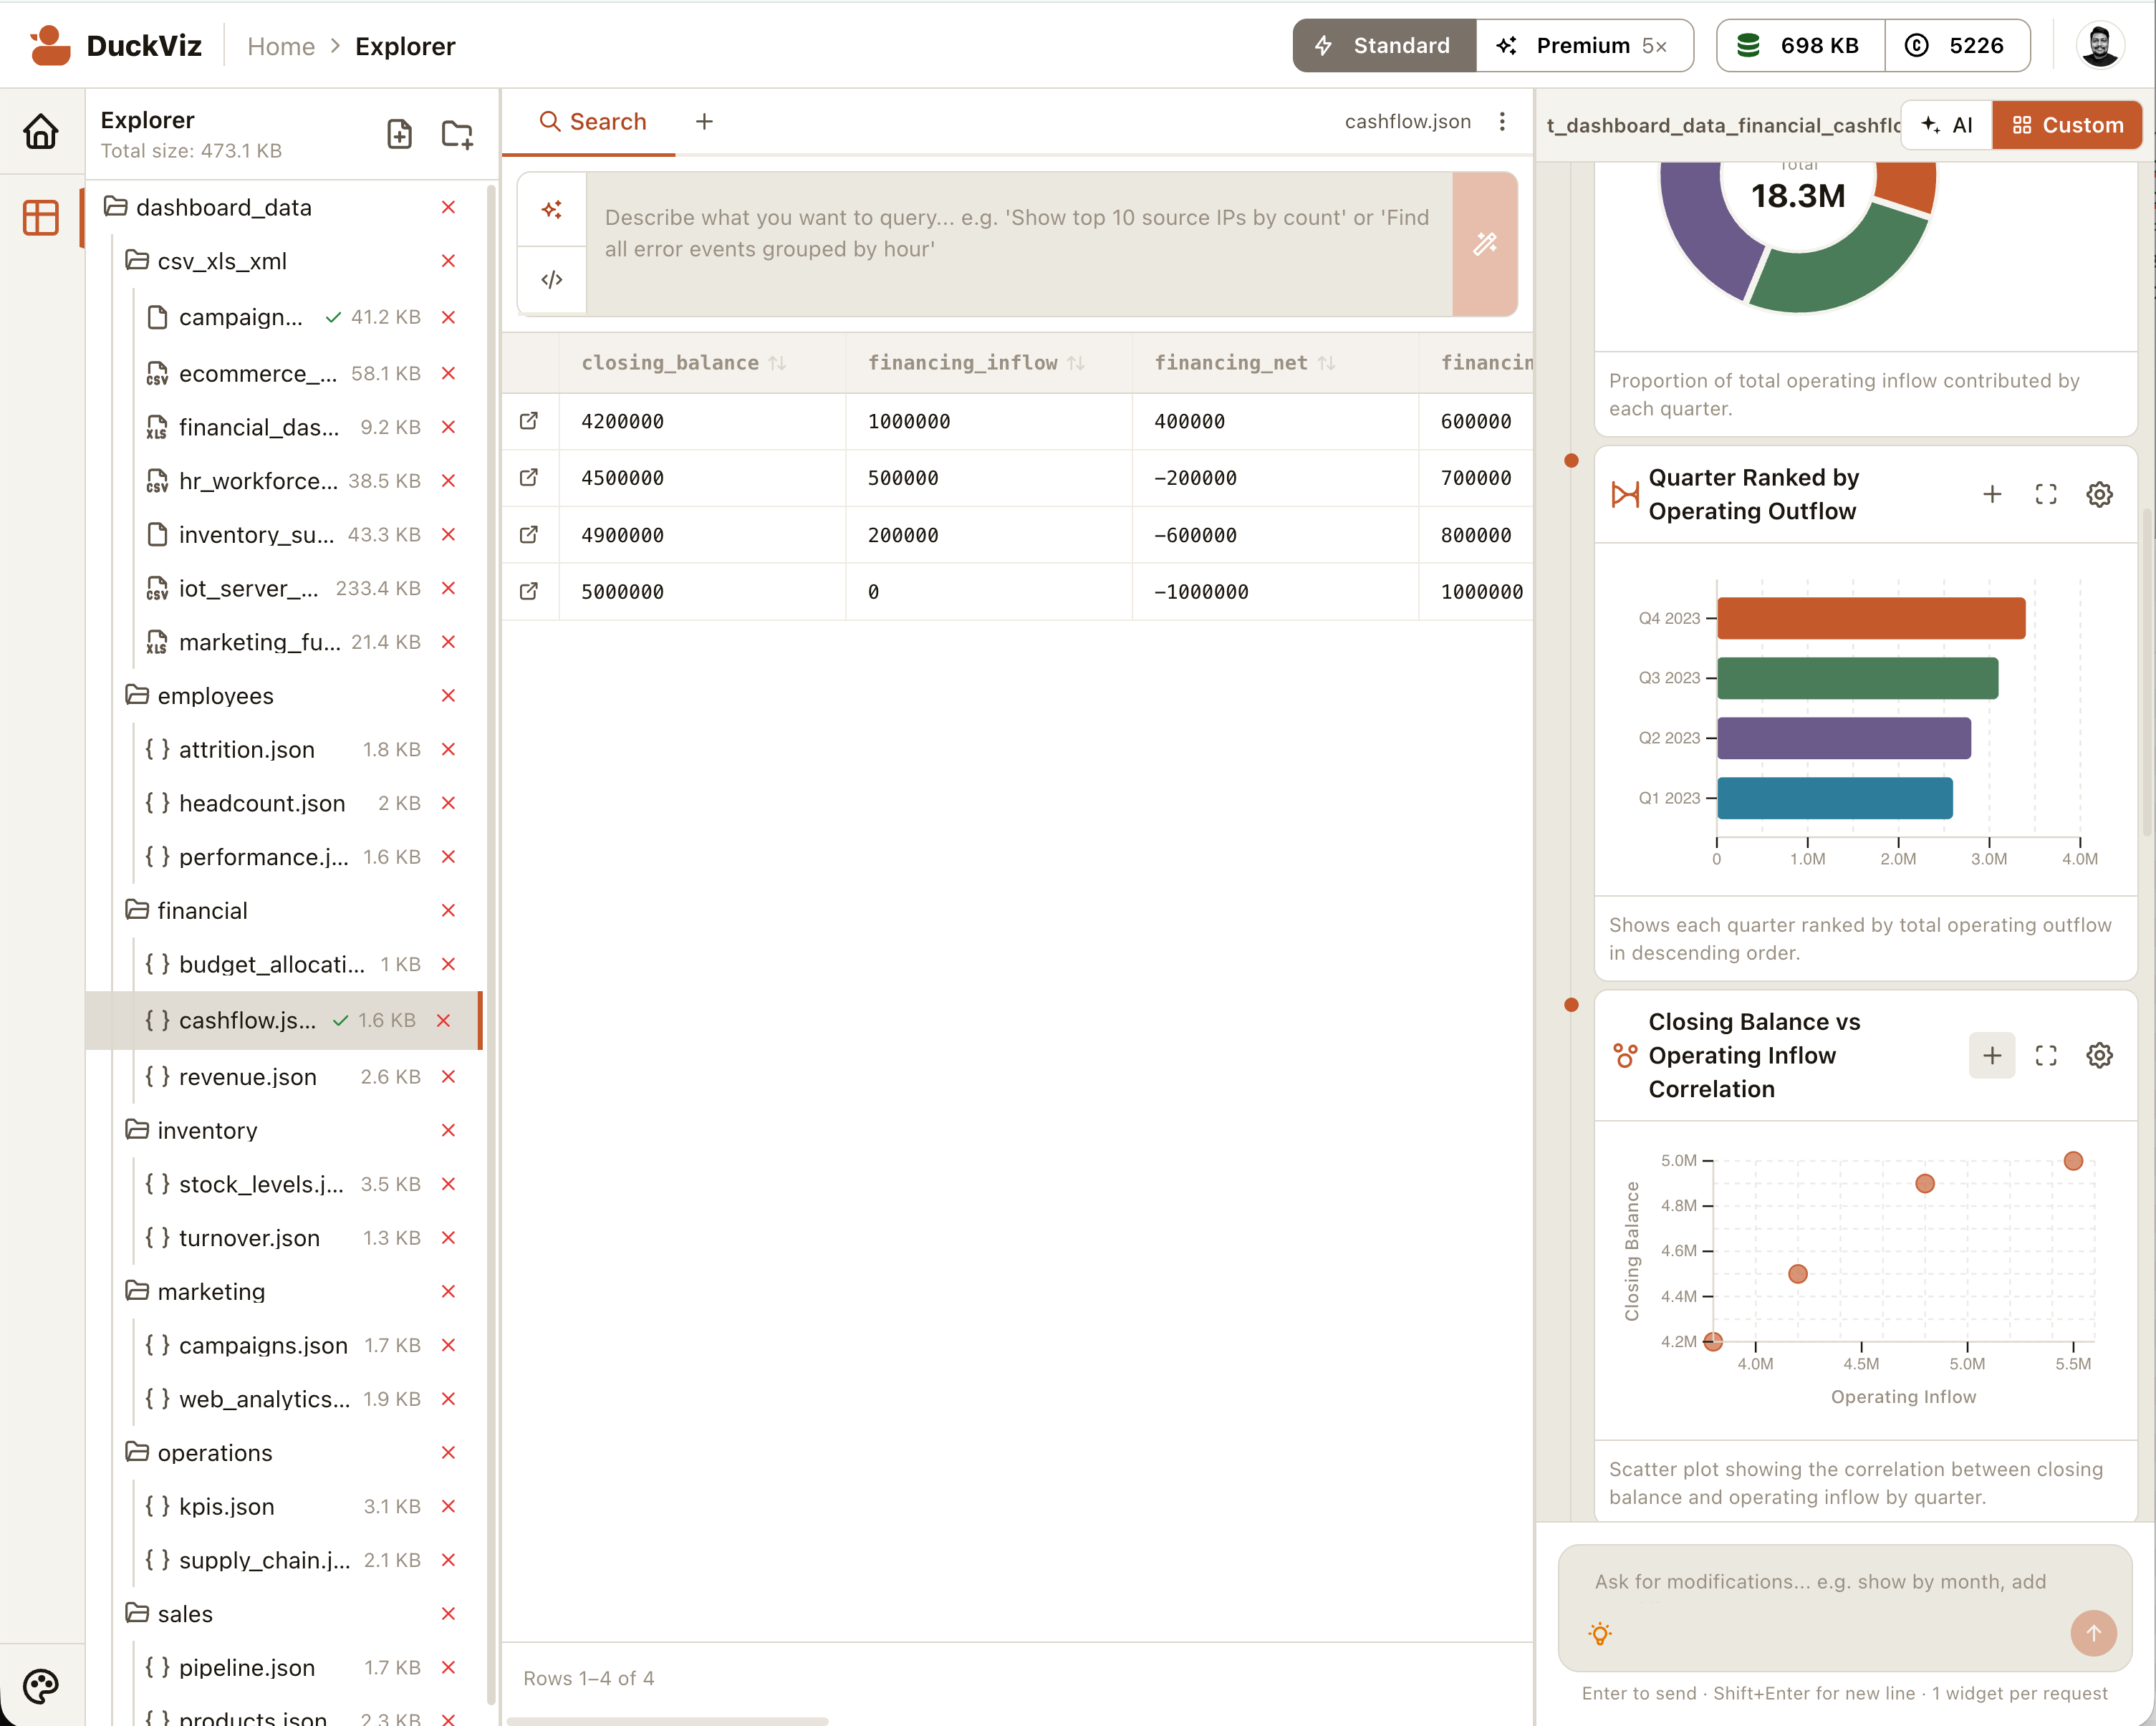
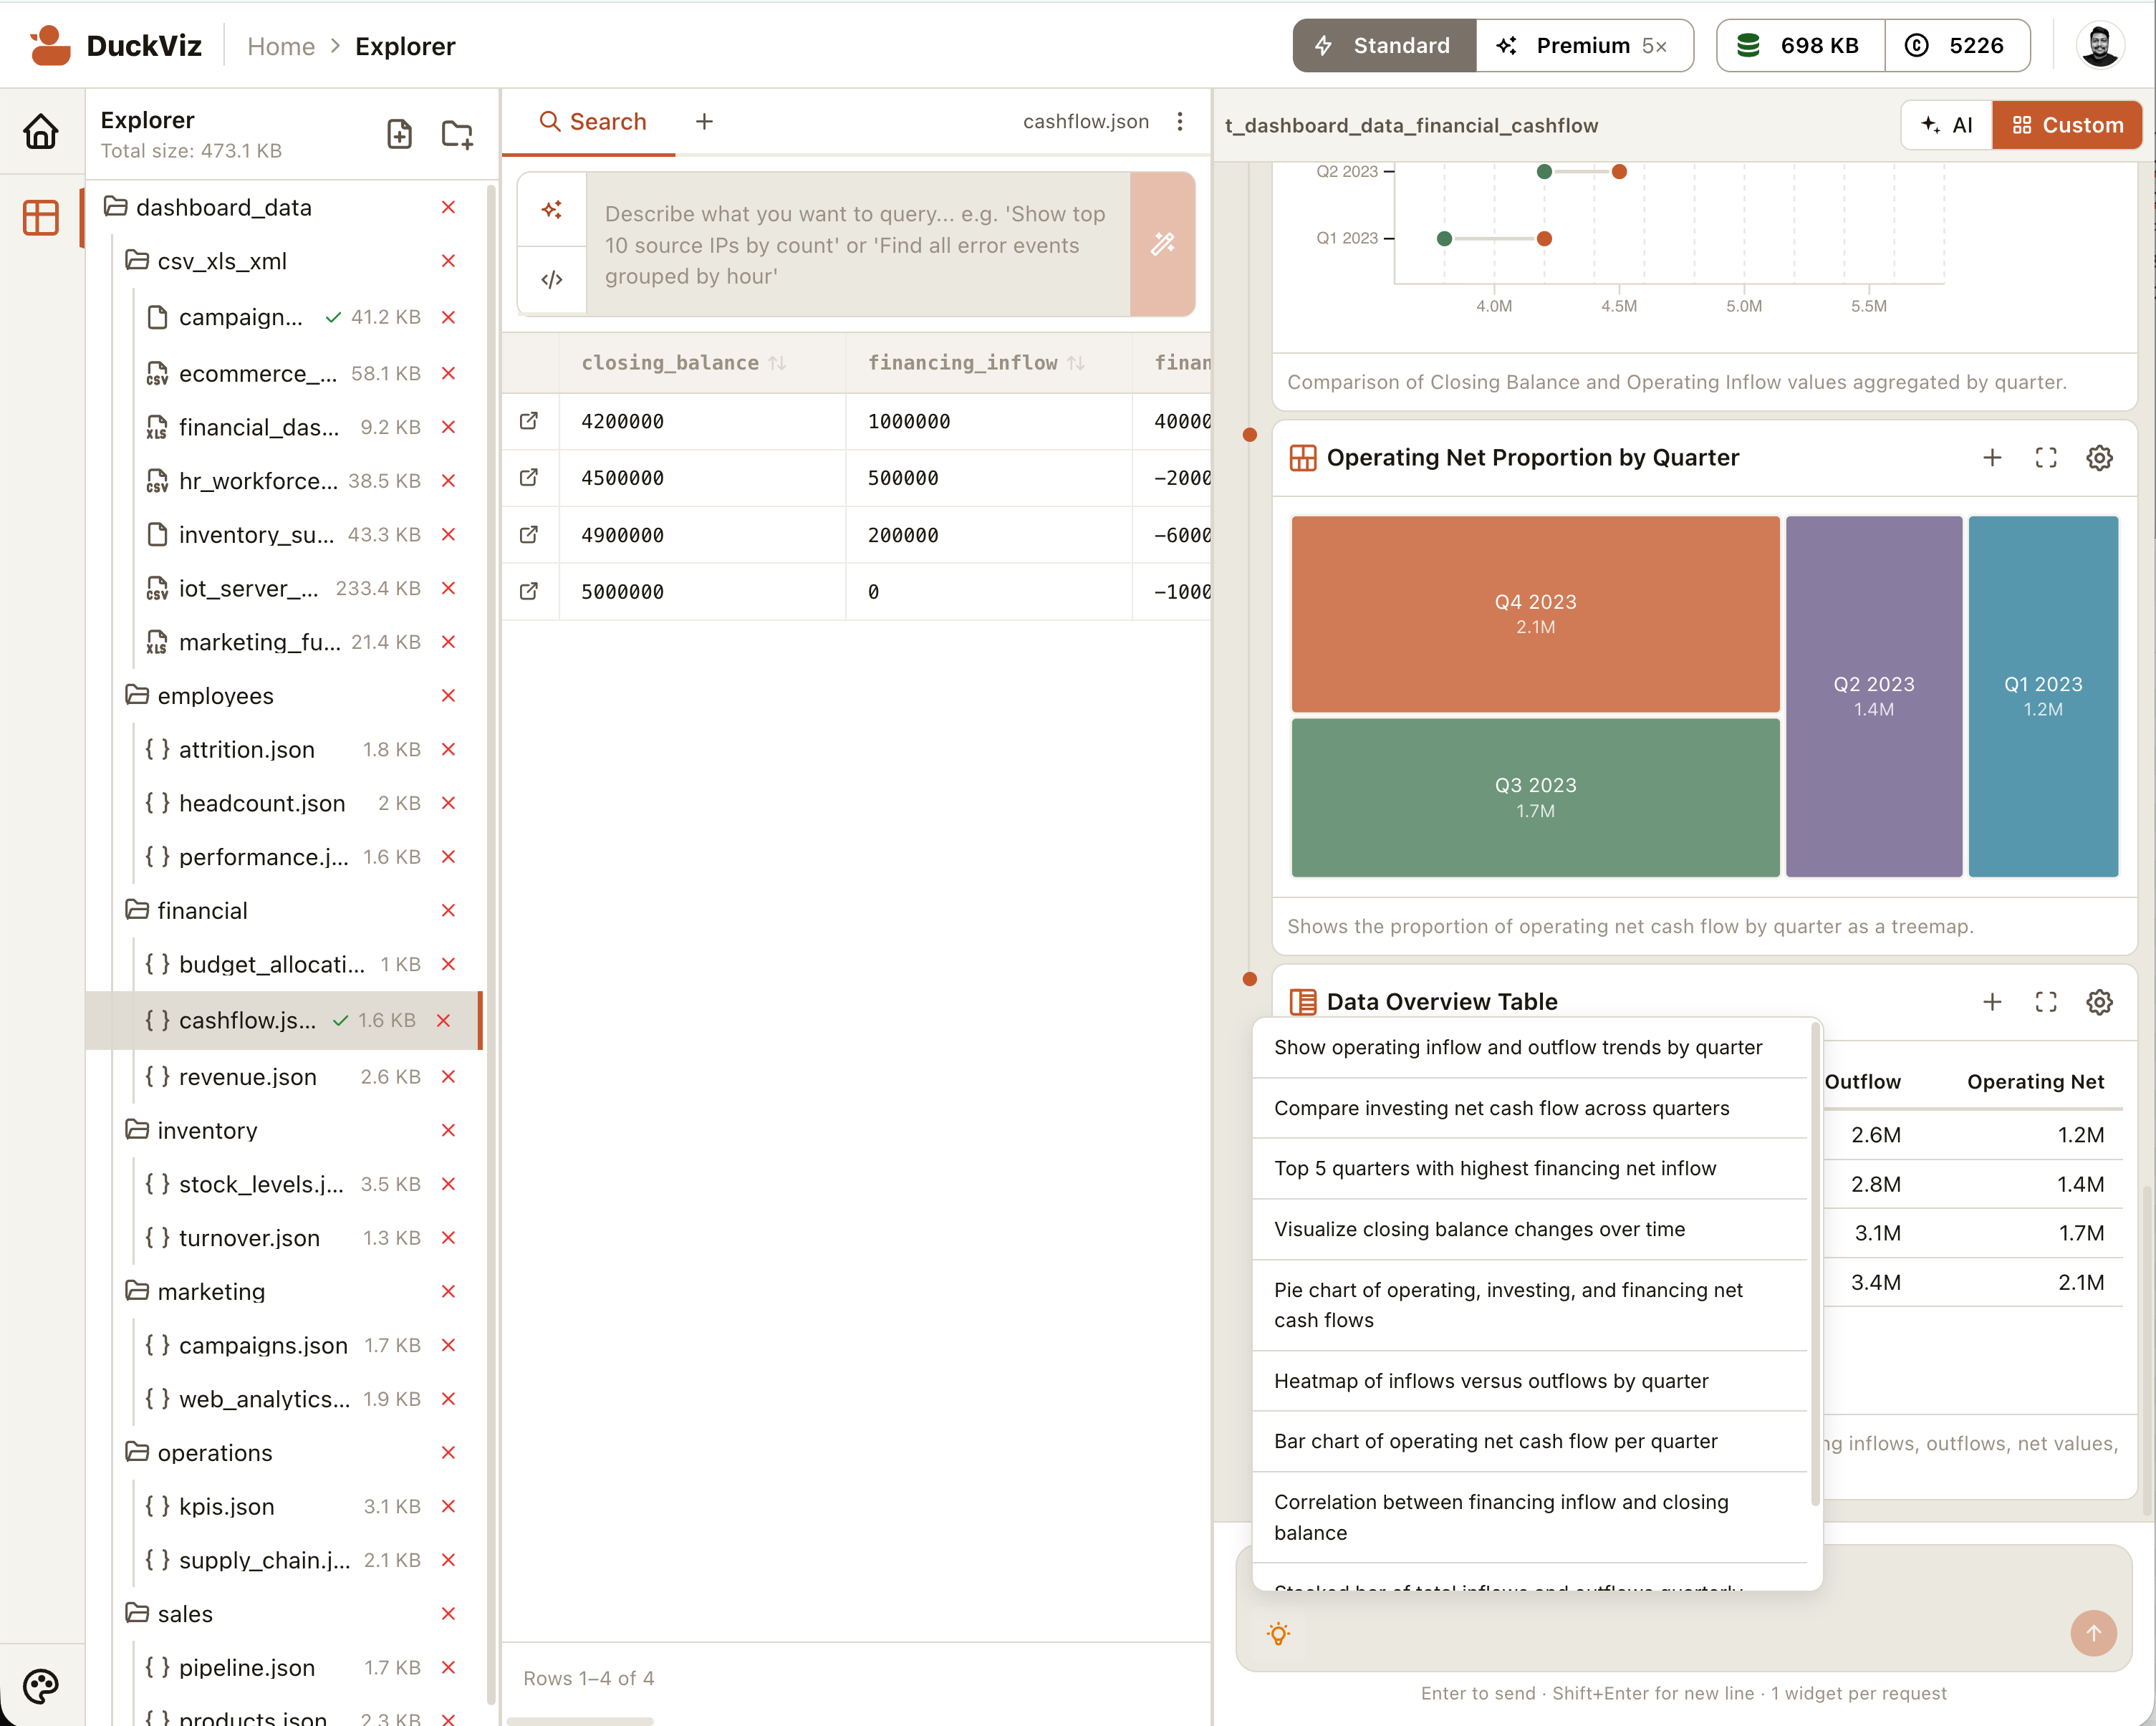
Generate AI widgets
The AI widget pipeline runs automatically once the table is ready:
- Classifies your data domain (e.g. "Sales", "Network Logs", "Web Traffic")
- Picks chart types from 80+ available based on your actual column shapes
- Generates a SQL query per chart and renders it
Charts stream in one by one in the right panel. Click the + button on any chart to add it to your dashboard.
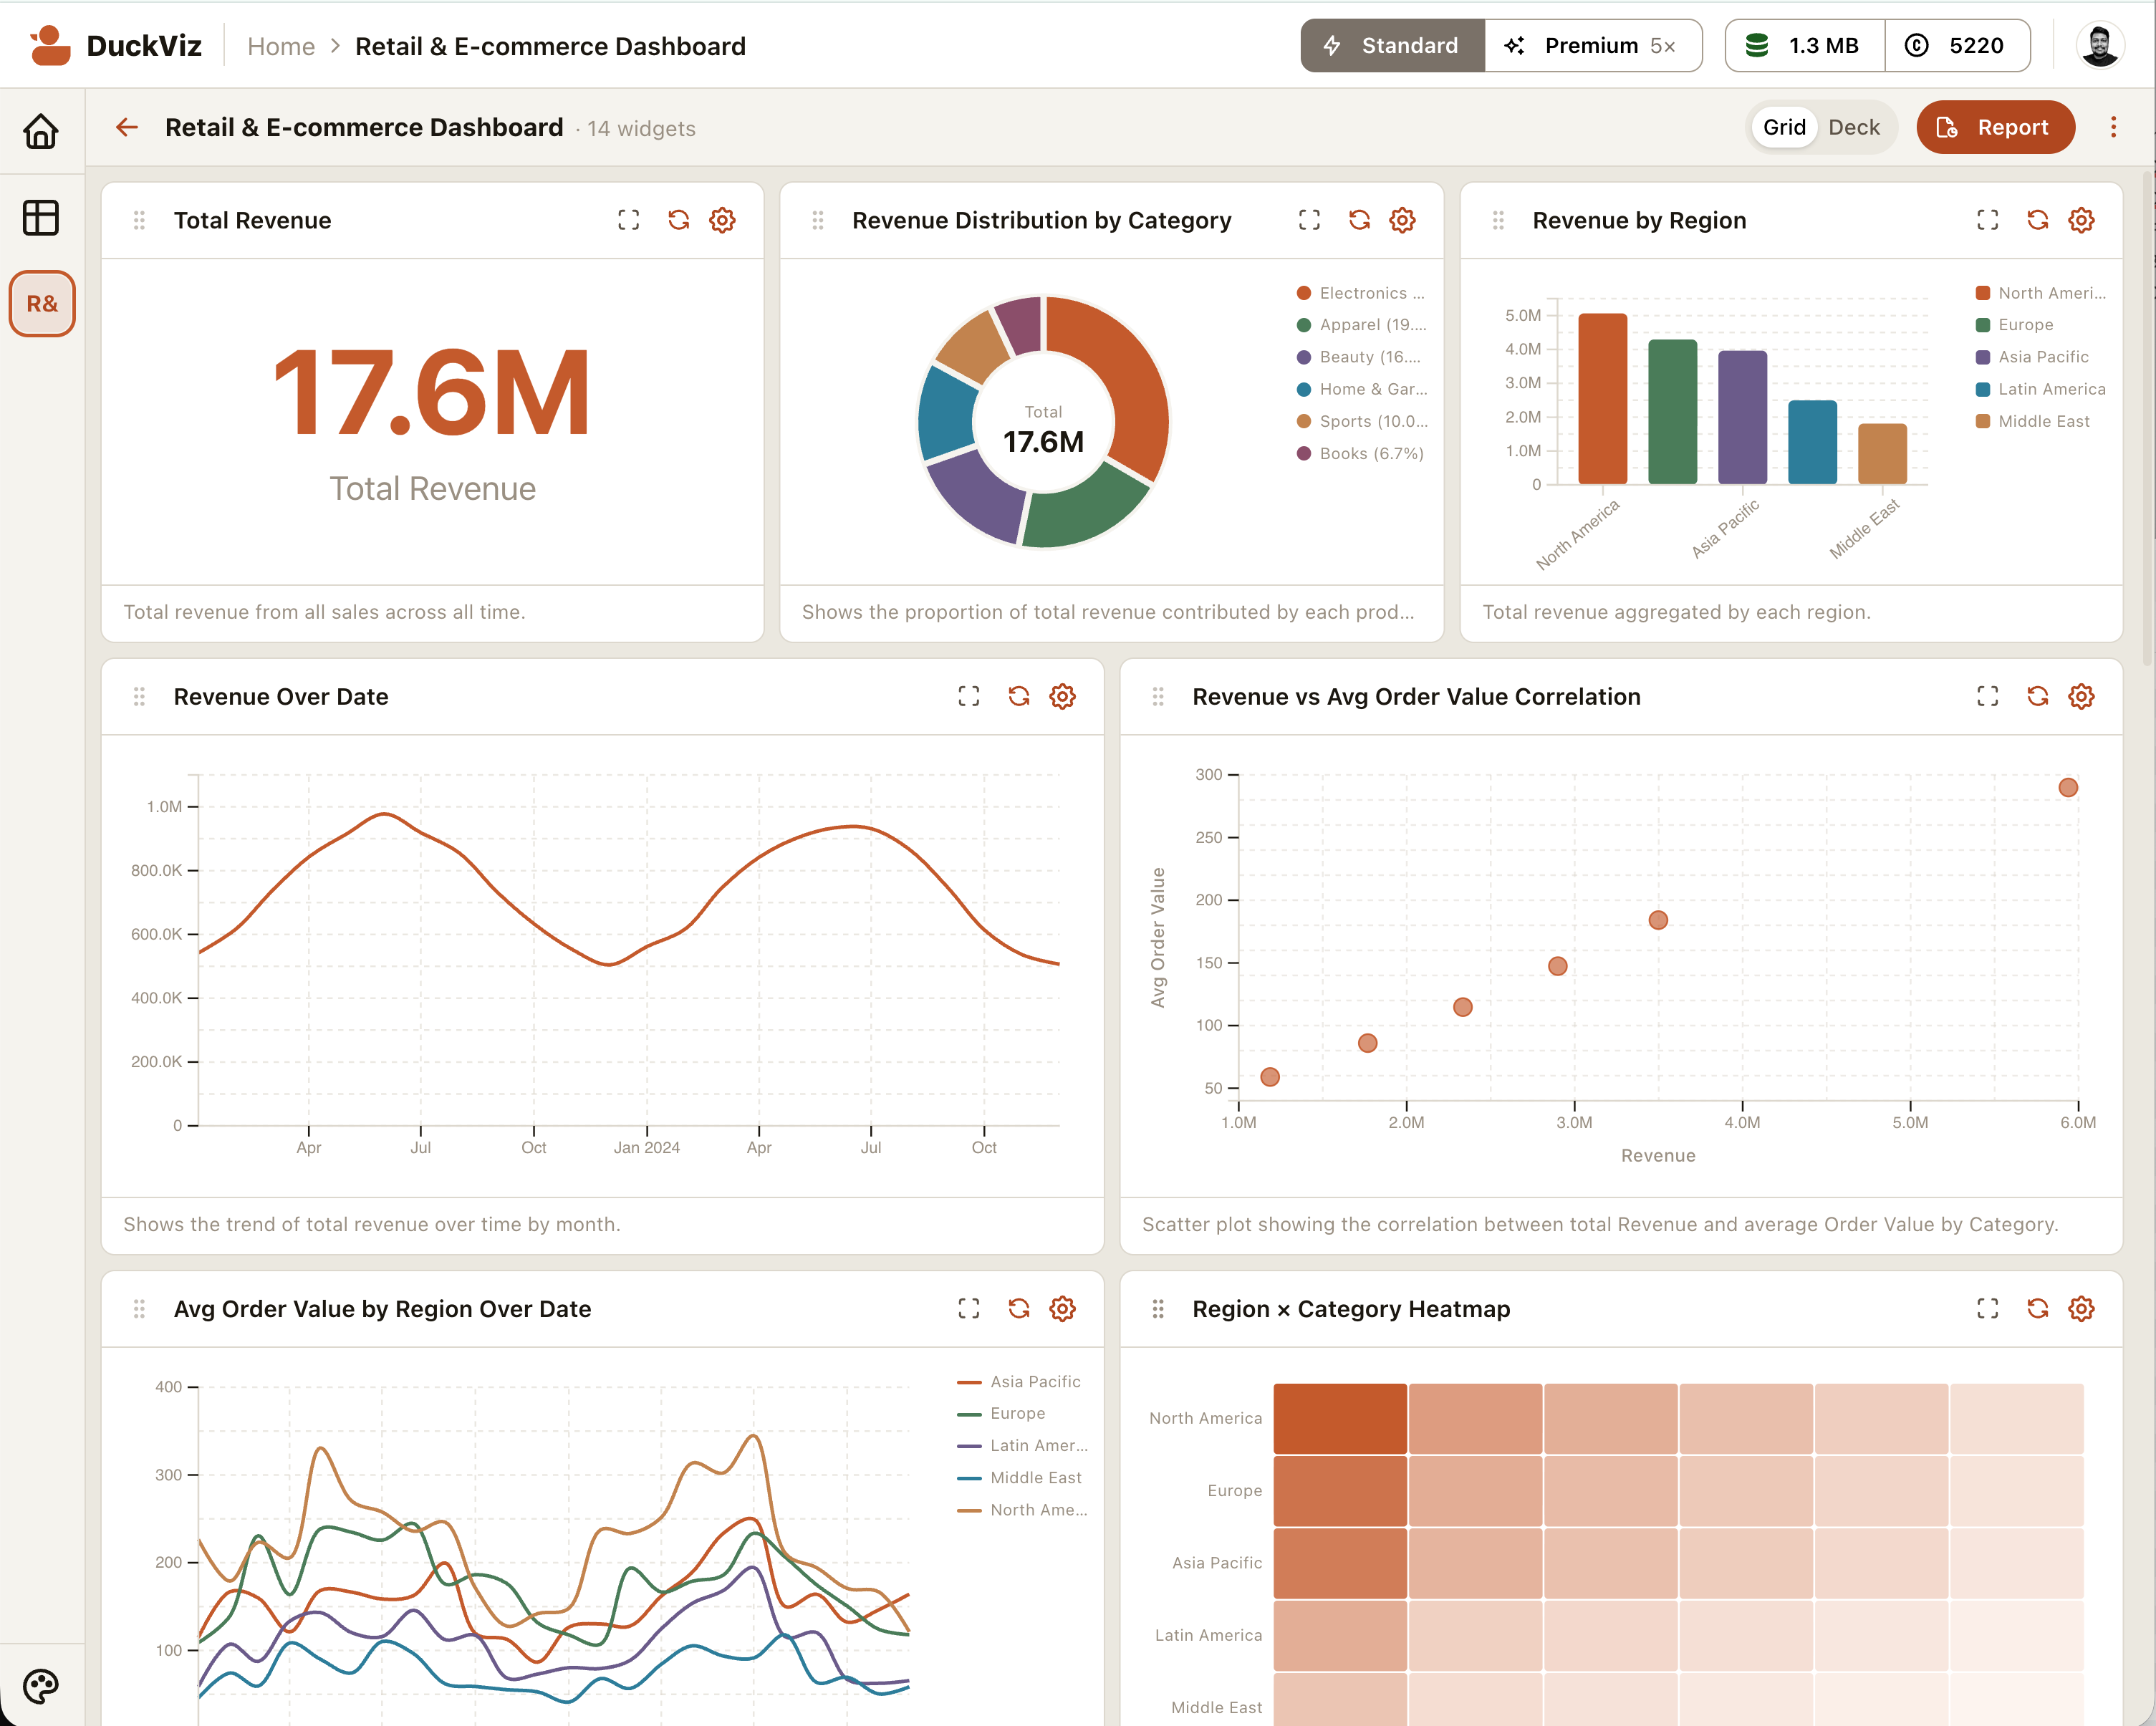
Build a dashboard
Open the Dashboard view from the sidebar. Your added widgets appear in a 12-column draggable grid. You can:
- Drag widgets to rearrange them
- Resize from the bottom-right corner
- Add more by returning to the Explorer and clicking +
Layouts are saved automatically per dashboard.
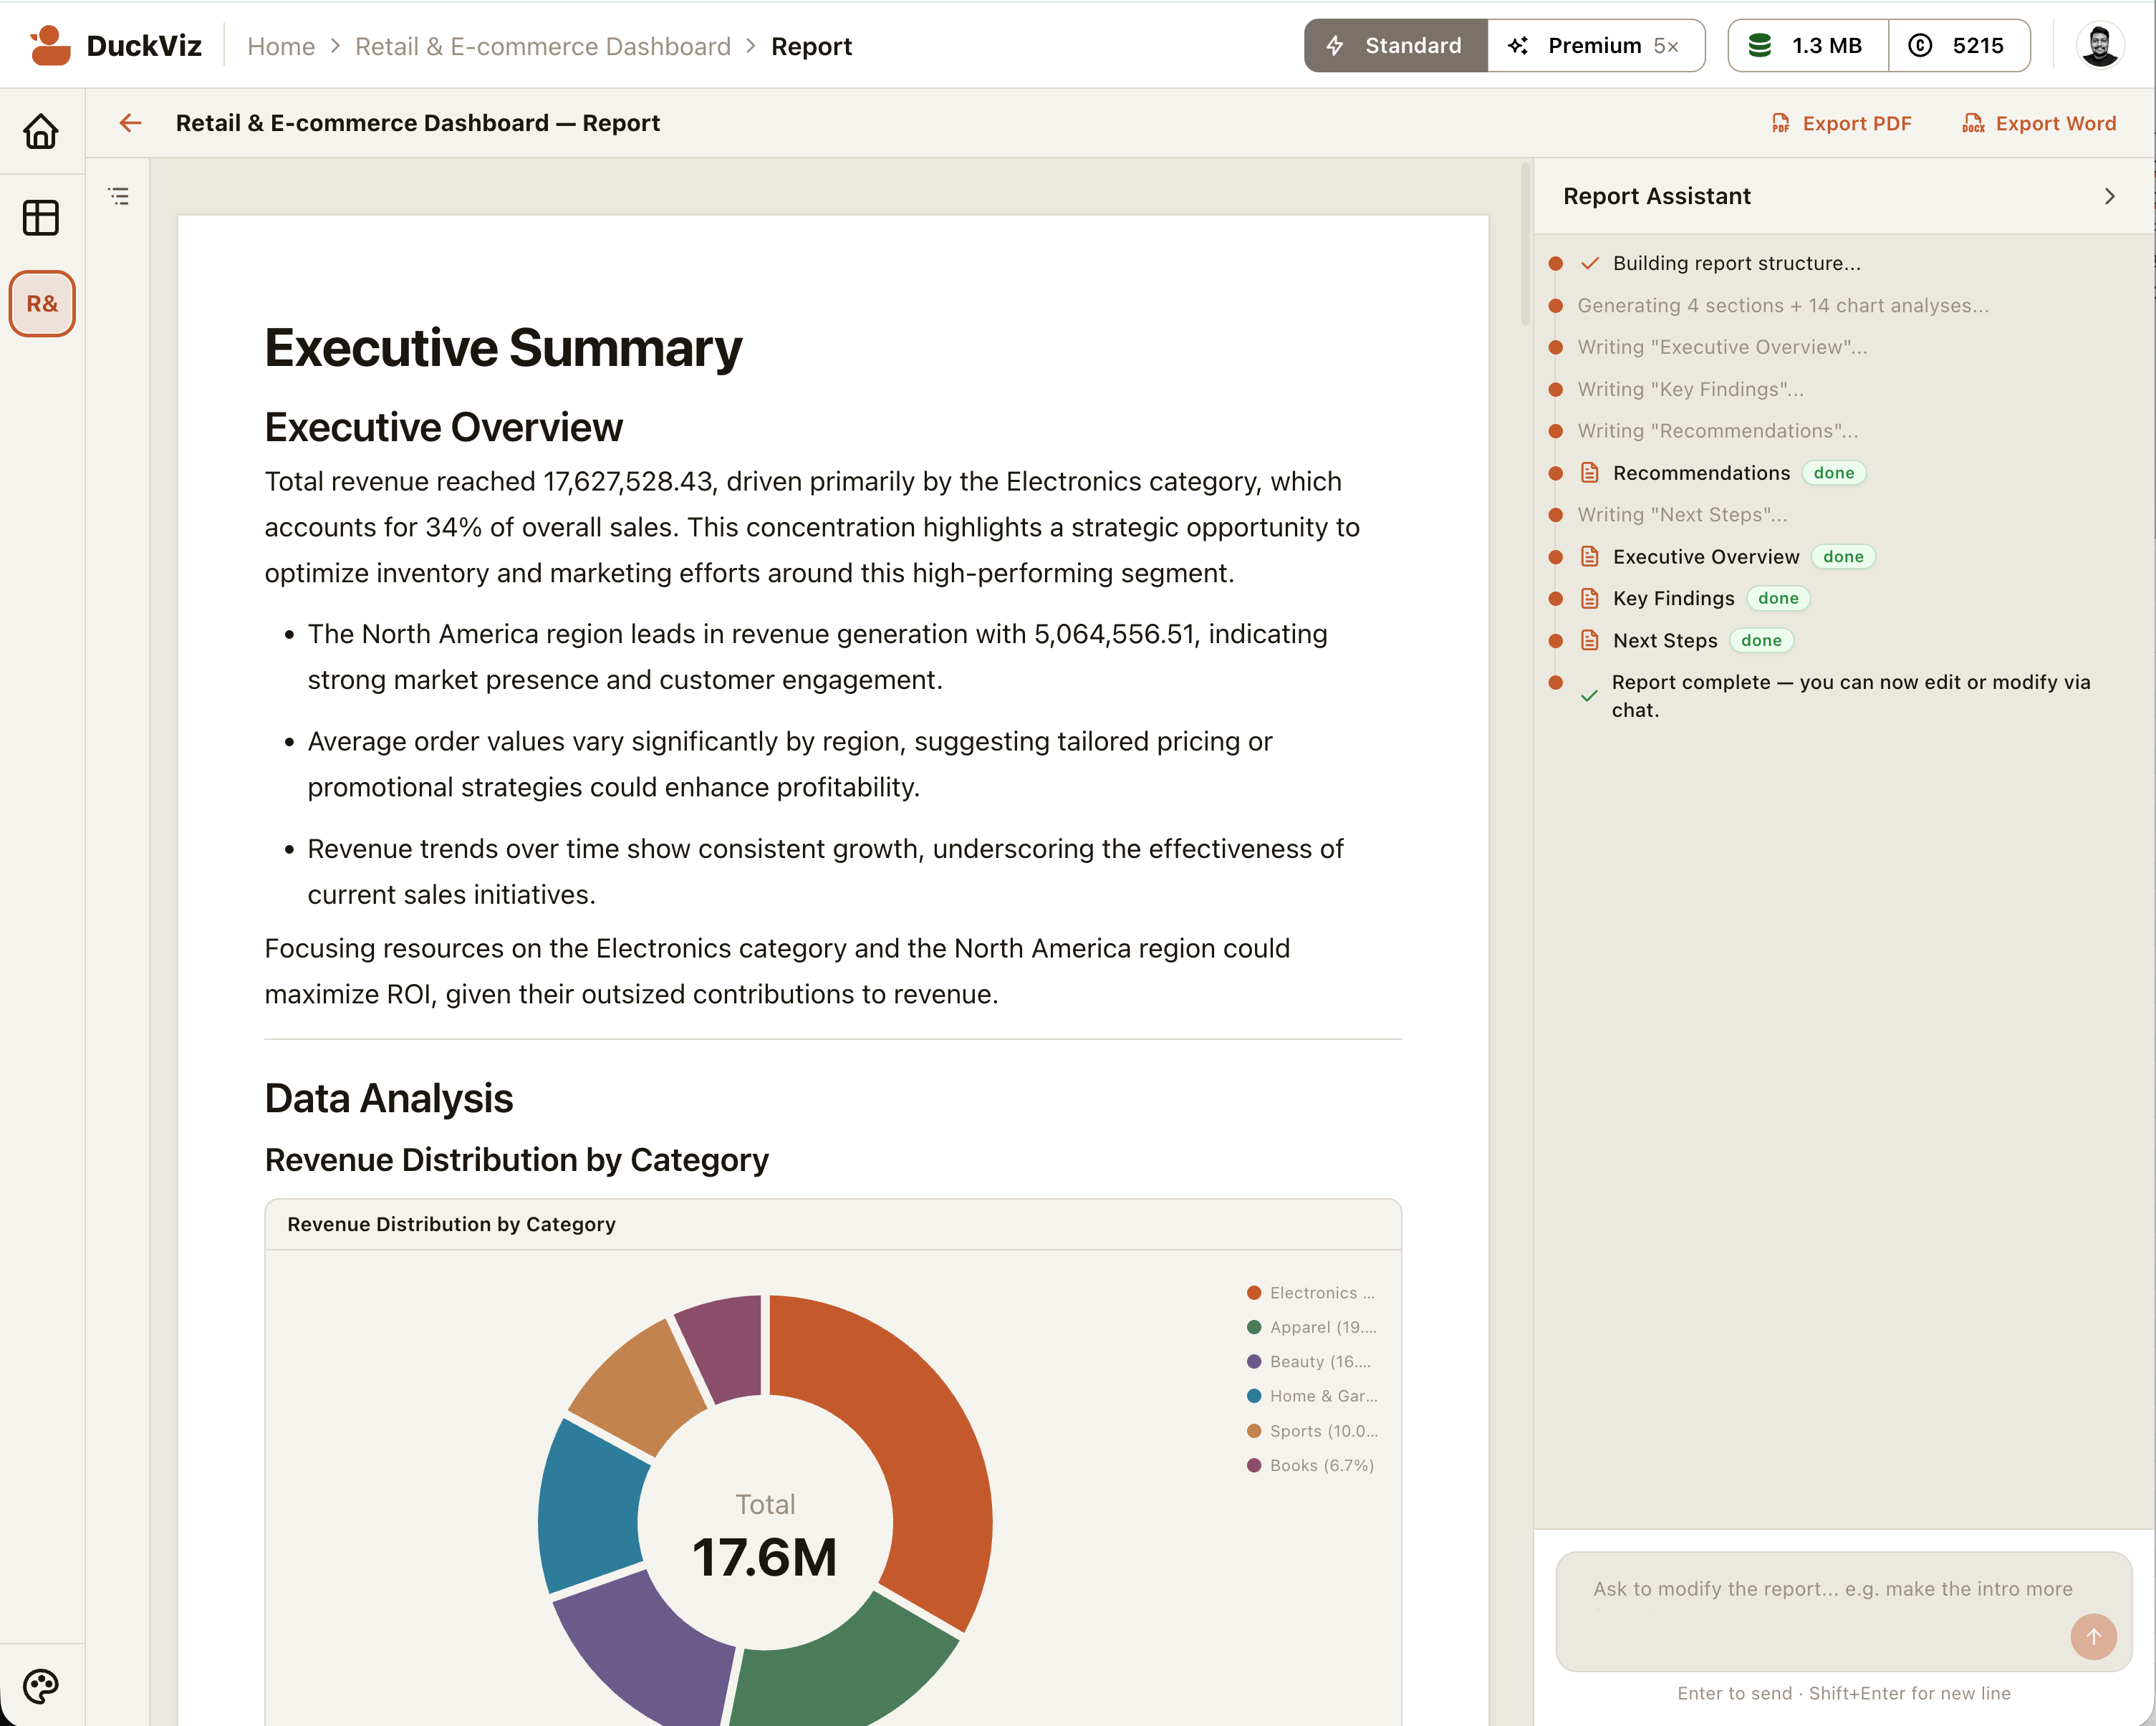
Generate a report
Click Generate Report on the dashboard. DuckViz:
- Auto-selects a template based on your data domains
- Builds an instant scaffold with headings and chart blocks (no AI call)
- Streams executive-summary content section by section (~1-2s each)
- Fills in
{{variable}}placeholders with live values from your data
Edit any block in place, use the / slash menu to insert new blocks, or ask the AI chat panel to modify sections. Export as PDF, DOCX, or PPTX.
Next steps
- Core Concepts — understand the architecture in more depth.
- Product Guide — detailed docs for every feature.
- CLI — push files from your terminal instead of using the upload UI.
- Developer quickstart —
npx duckviz create-appif you want to embed DuckViz in your own React app.